Put your GTM Strategy on RailsAI-enabled, closed loop GTM operating system.
Accelerate end-to-end GTM strategy & campaign development, gain ELT alignment, and activate a plan that is rooted in real funnel economics at the campaign level.
The GTM operating system
Six steps. One source of truth.
Each stage builds on the last. AI drafts everything (Campaigns rooted in funnel metrics, mapped to the cube). You steer, refine, and lock. Locks cascade downstream so a budget change can't silently break campaigns or readouts.
Drop a URL. AI researches your company, ICPs, products, and competitors.
Set TAM, sourcing mix, and growth targets per ICP. AI estimates universe sizes.
Allocate annual spend across ICPs and funnel stages, calibrated to economics.
AI generates campaigns per box: channels, hooks, assets, expected output.
Filter, scatter, atomize. Spot the bets to double down on before you ship.
Export a six-slide deck. Branded, AI-narrated, board-ready.
The GTM data layer
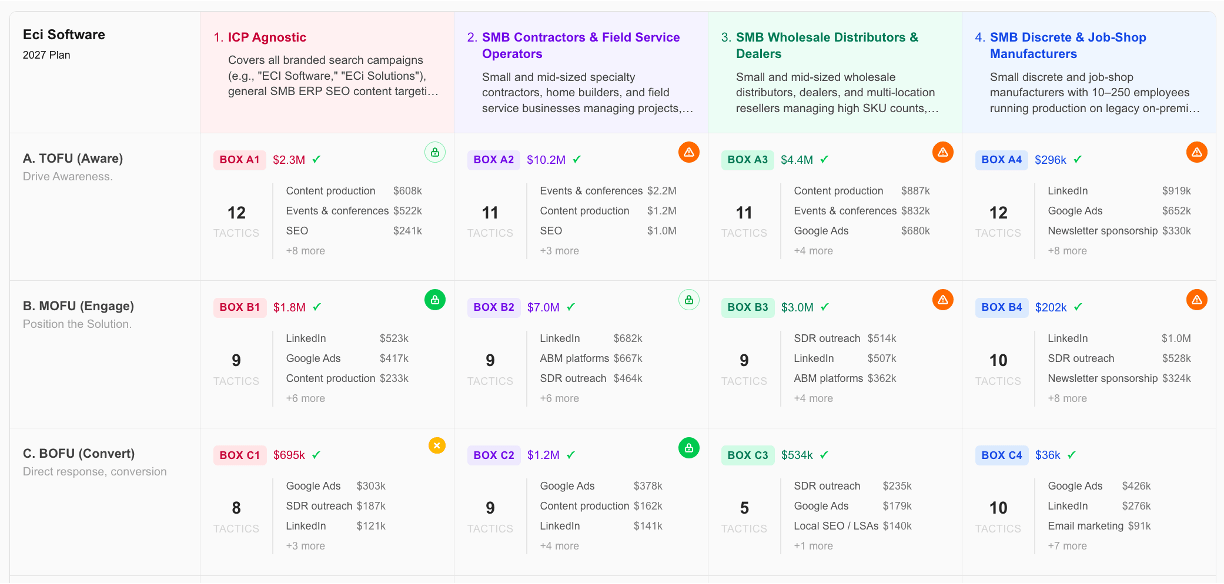
Every GTM activity mapped to the cube.
Campaigns don't float free. Each BOX in the cube (one ICP × one funnel stage) carries spend, expected leads, MQL/SQL conversion, and a payback projection. Tweak any input and the rest re-models live.
ICP × stage matrix. Boxes labeled 1A, 2B, 3C: readable at a glance, agent-friendly under the hood.
Funnel economics built in. CPL → cMQL → cSQL → mCAC → Pipeline → Bookings, with payback and cLTV:mCAC headlines.
Live re-modeling. Adjust budget, growth target, or conversion and watch the downstream numbers settle in real time.
Activities tied to outcomes
Every campaign, mapped to outcomes.
Each box on the cube is a fully modeled campaign with working budget, CPL, conversion rates, and downstream volume from leads through bookings. Edit any input and the funnel re-models in real time.
Inputs you control. Override CPL or conversion rates per campaign; volume recomputes live.
Volume + efficiency in one view. Leads through bookings, plus cost per stage and ROI multiples.
Idea → promoted → in plan. Clean status flow with revert paths and an AI enrich button per card.
Distribute 4–6 gated thought leadership pieces (“8 causes of inventory shrinkage in multi-warehouse distribution”) through NetLine, TechTarget, and industry vertical networks targeting supply chain and operations buyers. Generates 300+ MQLs annually at $310 CPL.
AI that hones your strategy
Your AI GTM expert helps guide along the way.
Ask the agent to rebalance the budget, split an ICP, or regenerate a single campaign. Every proposal is reviewable before you commit, and every locked stage stays locked until you say otherwise.
Generate, refine, regenerate. First drafts at every stage. Enrich a single box, regenerate a row, or rerun the whole budget.
Reviewable mutations. Agent proposals show up as a chip. Accept, edit, or dismiss before anything changes.
Lock the chain of custody. Locks cascade downstream. Unlock to regenerate; the system warns you what gets invalidated.
AI that helps you see around corners
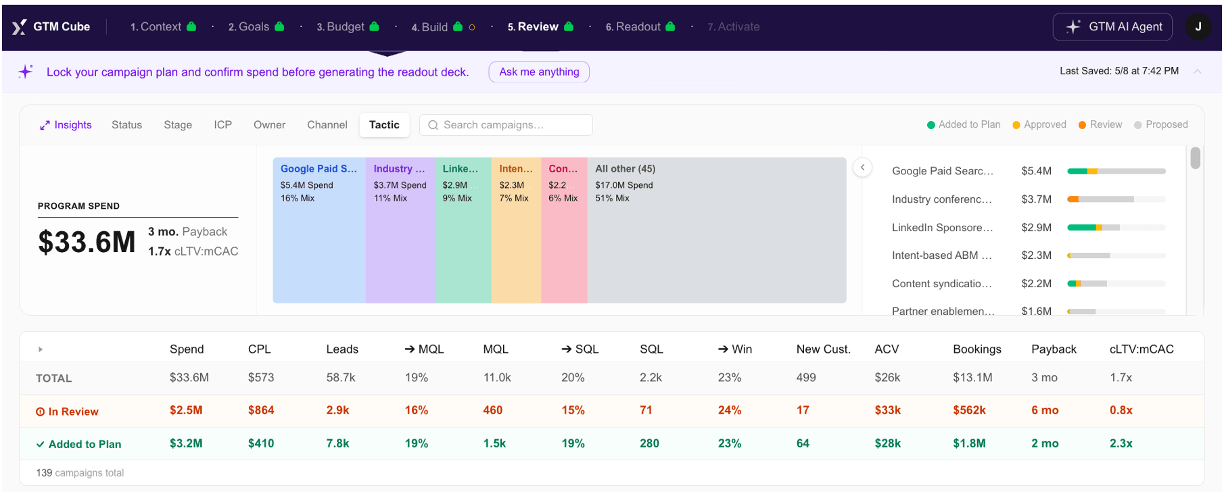
Insights clearly surface key bets.
Filter by ICP, channel, stage, or owner. Atomized scatter plots campaign-level efficiency. The insights bar surfaces channel mix and budget weight at a glance, so you can see the bets to double down on, and the ones quietly leaking budget.
$2.8M on Google Paid Search (Non-Brand)Contractor ERP & Job Costing, Awareness
$603k on Industry conf. sponsorshipDistributor & Logistics events, below median
$489k on Live webinar'Field Crews Without Chaos', below median
$367k on Executive roundtableDistribution & Supply Chain Forum
Key features
Atomized scatter. One dot per campaign. Bubble size = spend, axes you choose (volume × productivity).
Channel insights bar. Stacked treemap of channel-group mix. Click a slice to filter the entire view.
Multi-dimensional filters. ICP, channel, stage, owner, status. Combine freely, see the cube re-aggregate.
AI that accelerates your thinking
Walk in with the plan, not just a strategy.
Six AI-written slides covering market, ICPs, budget allocation, funnel economics, campaign mix, and timeline. Branded to your company. Exported as PDF or PPTX.
ICPs
Five segments mapped to spend, win rate, and projected pipeline contribution
Forecast funnel
824 wins from 3,580 SQLs reveals a 23% SQL-to-win rate requiring stage tightening
| CHANNEL | SPEND | CPL | LEADS | MQLS | SQLS | WINS | PIPELINE | NEW BOOKINGS |
|---|---|---|---|---|---|---|---|---|
| Google Paid Search (Non-Brand) | $5.9M | $320 | 18,352 | 2,861 | 459 | 106 | $11.5M | $2.6M |
| LinkedIn Sponsored Content | $7.9M | $480 | 16,484 | 2,592 | 413 | 95 | $10.3M | $2.4M |
| AI search optimization (GEO) | $1.5M | $110 | 14,059 | 2,094 | 336 | 77 | $8.4M | $1.9M |
| Cold email outbound sequence | $2.2M | $180 | 12,256 | 1,894 | 303 | 70 | $7.6M | $1.7M |
| Live webinar | $1.9M | $165 | 11,537 | 1,920 | 308 | 71 | $7.7M | $1.8M |
| SEO pillar pages & topic clusters | $822K | $145 | 5,669 | 866 | 141 | 32 | $3.5M | $810K |
| SDR cold call cadence | $1.2M | $210 | 5,656 | 962 | 152 | 35 | $3.8M | $873K |
| Partner enablement program | $1.9M | $390 | 4,993 | 782 | 126 | 29 | $3.1M | $724K |
| All other (5 channels) | $4.9M | $671 | 7,286 | 1,142 | 184 | 43 | $4.6M | $1.1M |
Plan summary
Balanced $31.9M plan bets on paid media and two anchor ICPs
Plan posture. 50/50 balanced efficiency-to-growth posture preserves margin discipline while funding pipeline capacity across manufacturing, field service, and distribution.
The bet. Concentrates spend behind two anchor ICPs representing 63% of budget. Deep vertical IP creates defensible win rates against broader, less SMB-focused competitors.
The read. 0.6× ROAS and paid media at 43% of channel spend make funnel velocity the single most important near-term lever.
| ICP SEGMENT | BUDGET | SQLS | PIPELINE | WINS |
|---|---|---|---|---|
| SMB Discrete & Job-Shop… | $12.2M | 1,051 | $7.1M | 252 |
| SMB Contractors & Field… | $8.0M | 2,044 | $10.1M | 461 |
| SMB Wholesale Distrib… | $7.8M | 435 | $3.1M | 98 |
| ICP Agnostic | $3.8M | 0 | $0 | 0 |
| Total | $31.9M | 3,580 | $20.6M | 824 |